Pursue Blue Horizons
Confirm your fall 2025 enrollment by may 1
Become a Black Bear
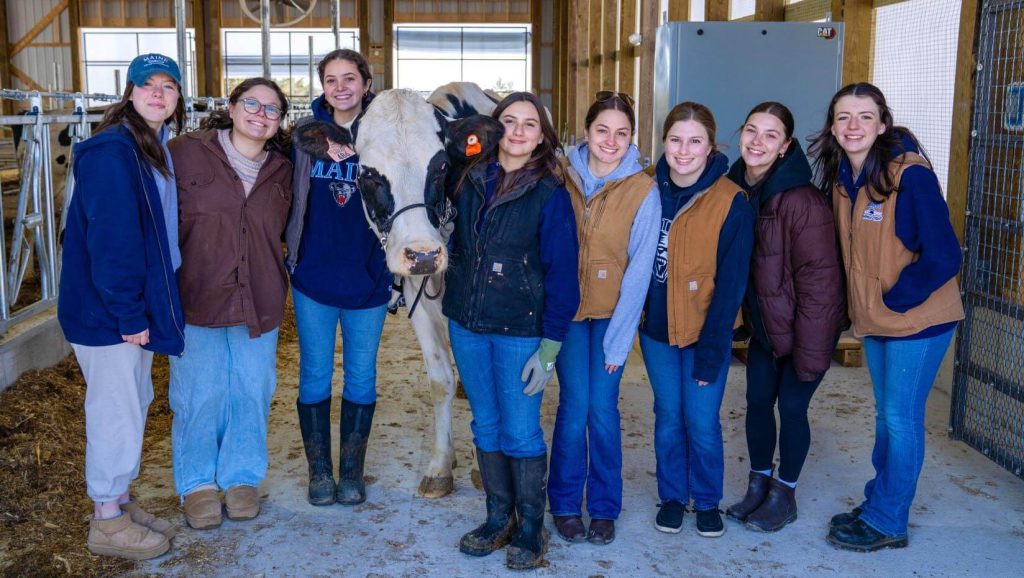
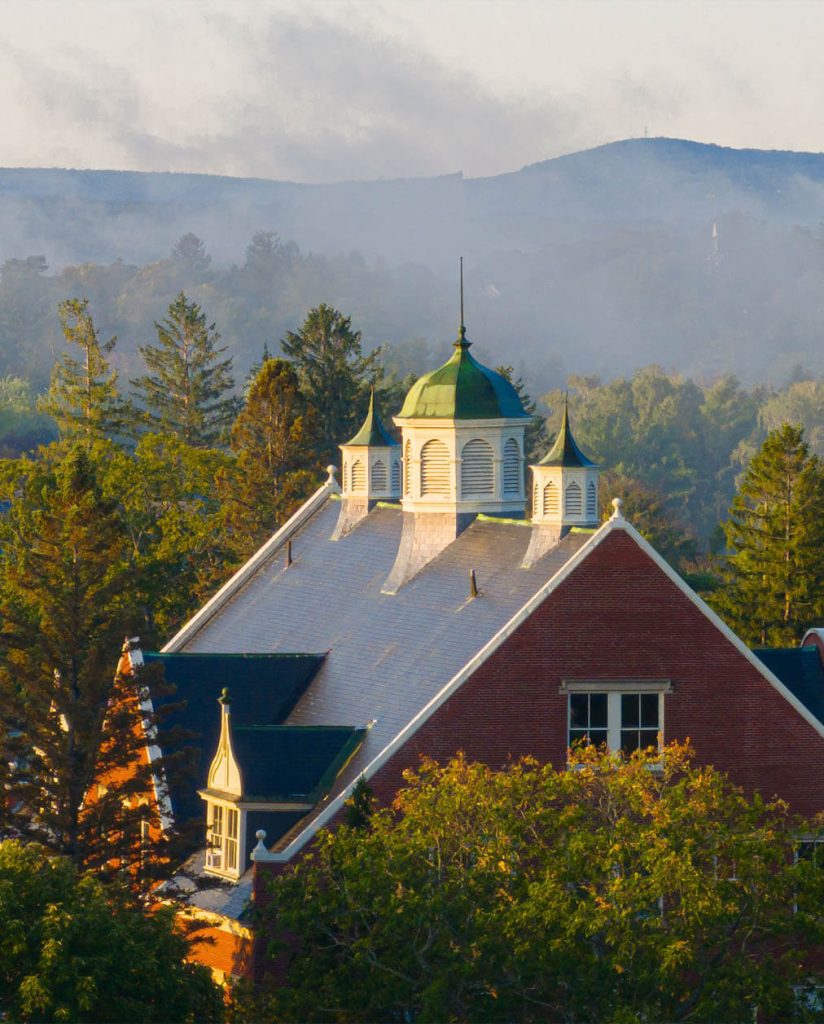
UMaine Black Bears are creating change through internationally recognized research. With the help of our world-class faculty and first-rate facilities, students develop the skills needed to build their future. Our campus in Orono, Maine — the safest state in America according to U.S. News & World Report — is located near some of the best year-round recreation sites in the nation.
Explore UMaine’s regional campus in Machias
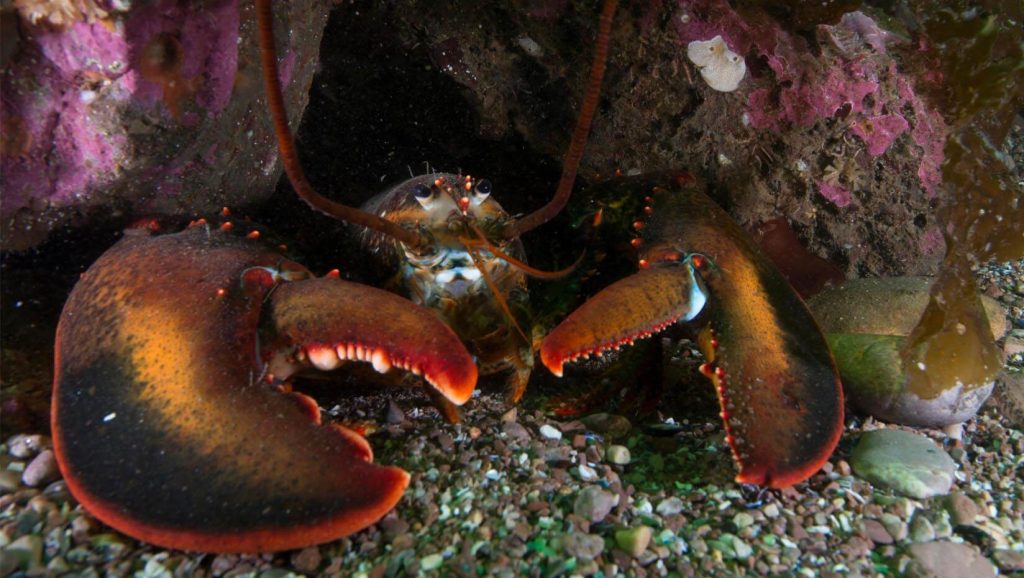
The University of Maine at Machias is the state’s coastal university, where the land and sea, communities and natural ecosystems provide the context for a unique learning and living experience.
Success after graduation
Based on ’22 First Destination Survey
95%
of graduates are employed, continuing their education or are in service
84%
of graduates
are working in a
field related
to their major
72%
of in-state
graduates
are working
in Maine
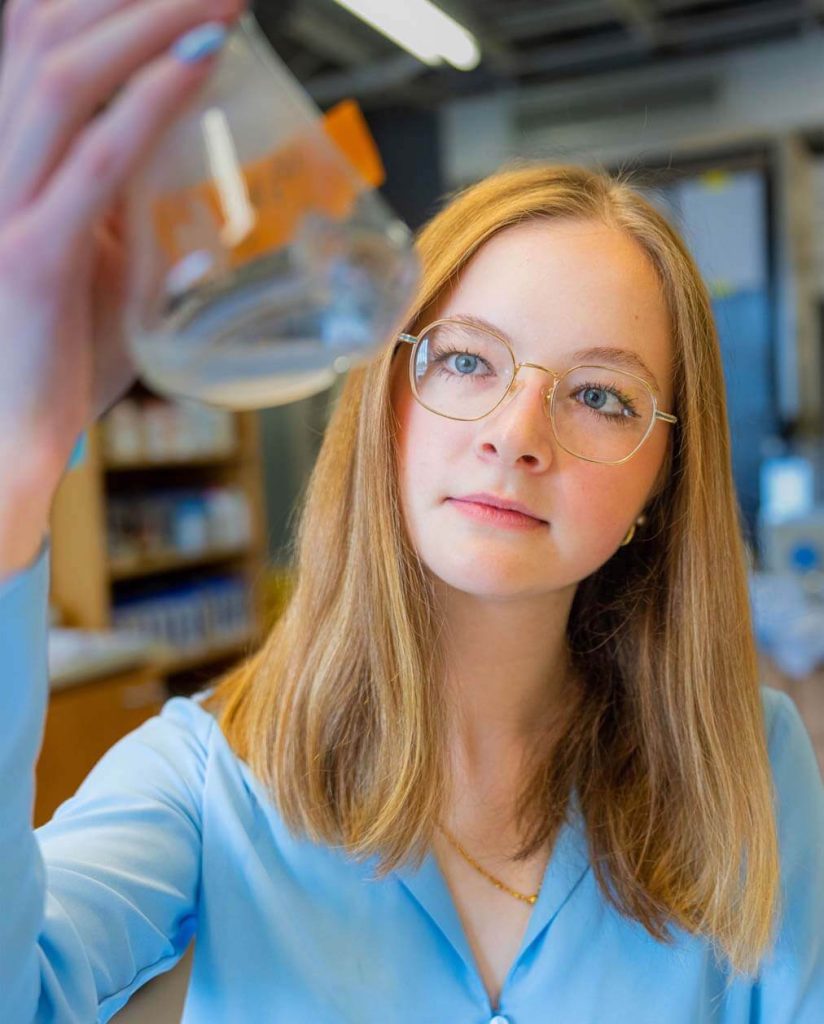
Discover your future career
With more than 100 degree programs available through our colleges and graduate school, you will find your future career at UMaine.
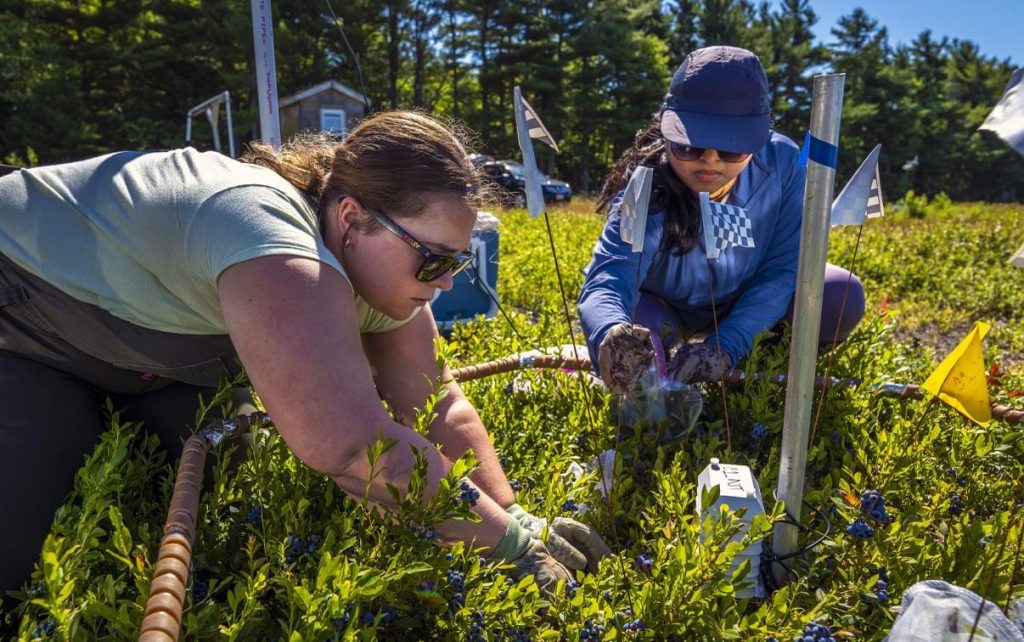
Unique opportunities like Research Learning Experience give first-year undergraduates a pathway to collaborate with friends and faculty on important research. Our undergraduates work with faculty conducting fieldwork around the globe — from the North Atlantic to the Antarctic — and intern throughout Maine and beyond to put their coursework into practice.
100+
majors & academic programs
16:1
student-faculty
ratio
150+
research institutes, centers and labs
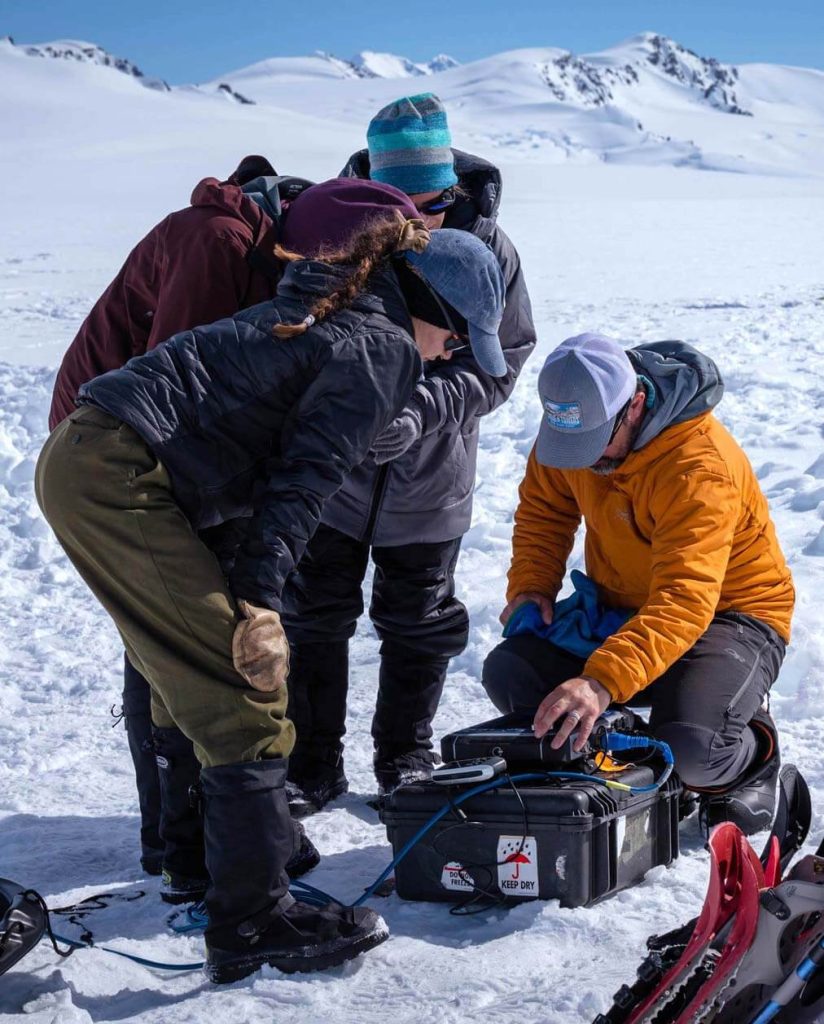
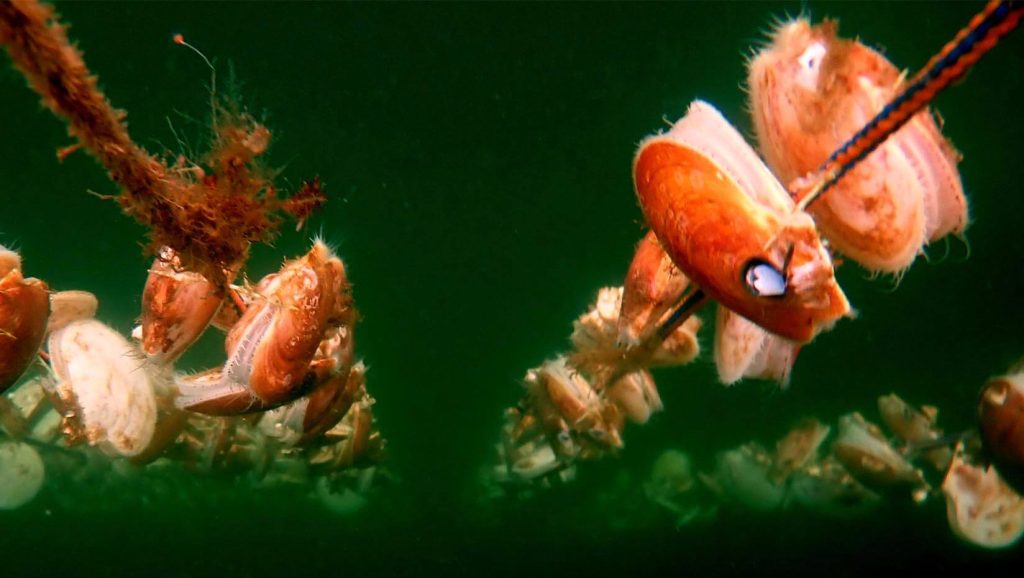
Research that drives progress
The University of Maine advances learning and discovery through excellence and innovation in its academic and research programs while addressing the complex challenges and opportunities of the 21st century through research-based knowledge. We are Maine’s public research university. Faculty, staff and students conduct research in every county in Maine, across the nation, and on all continents and in oceans worldwide.
Global impact, local relevance
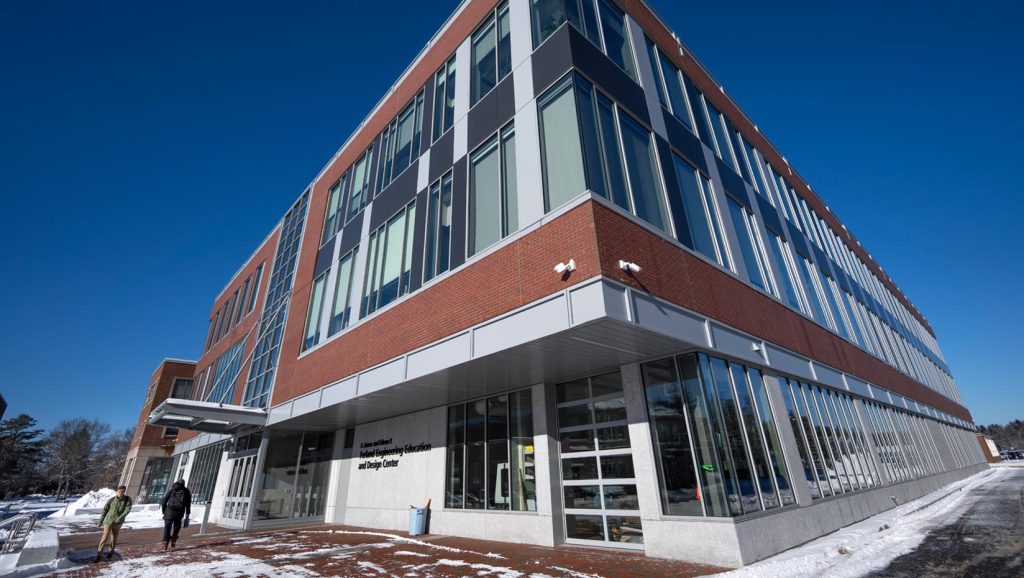
UMaine is a Carnegie R1 top-tier institution, a classification that reflects UMaine’s commitment to cutting-edge research, innovation and academic excellence. Our internationally recognized programs allow us to address workforce needs and advance the social and economic development in Maine and beyond.

Research centers & institutes
UMaine is home to a diverse range of research centers and institutes, each dedicated to advancing knowledge and addressing real-world challenges.
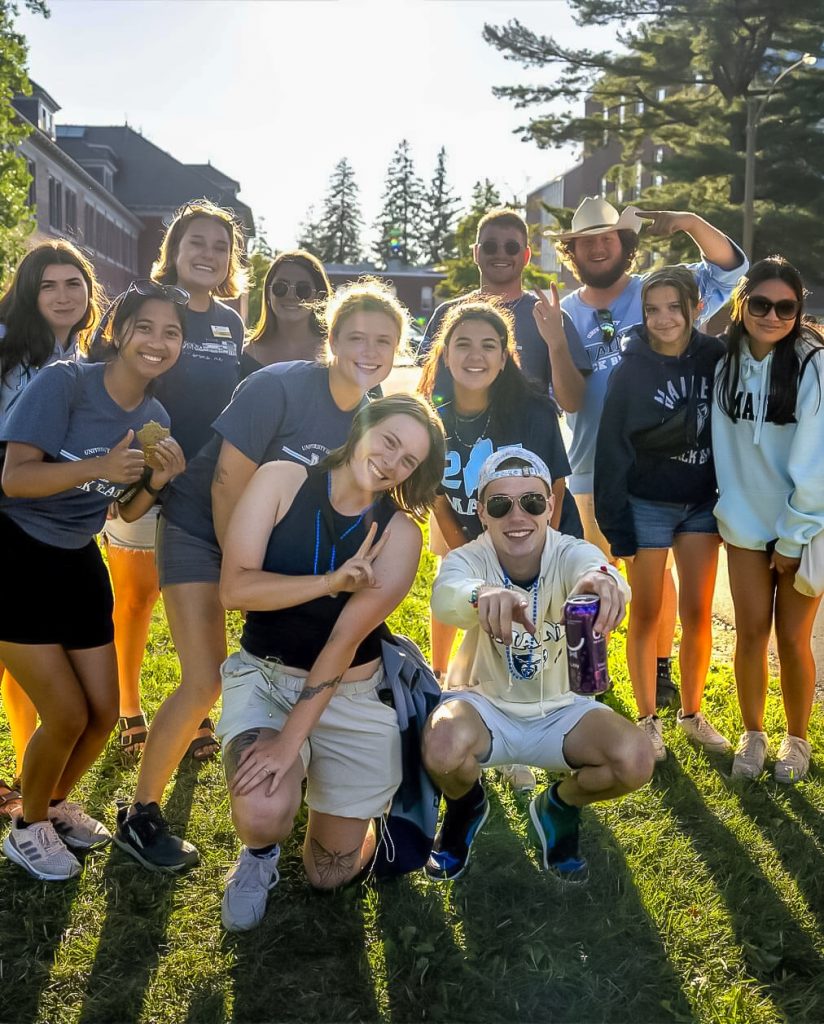
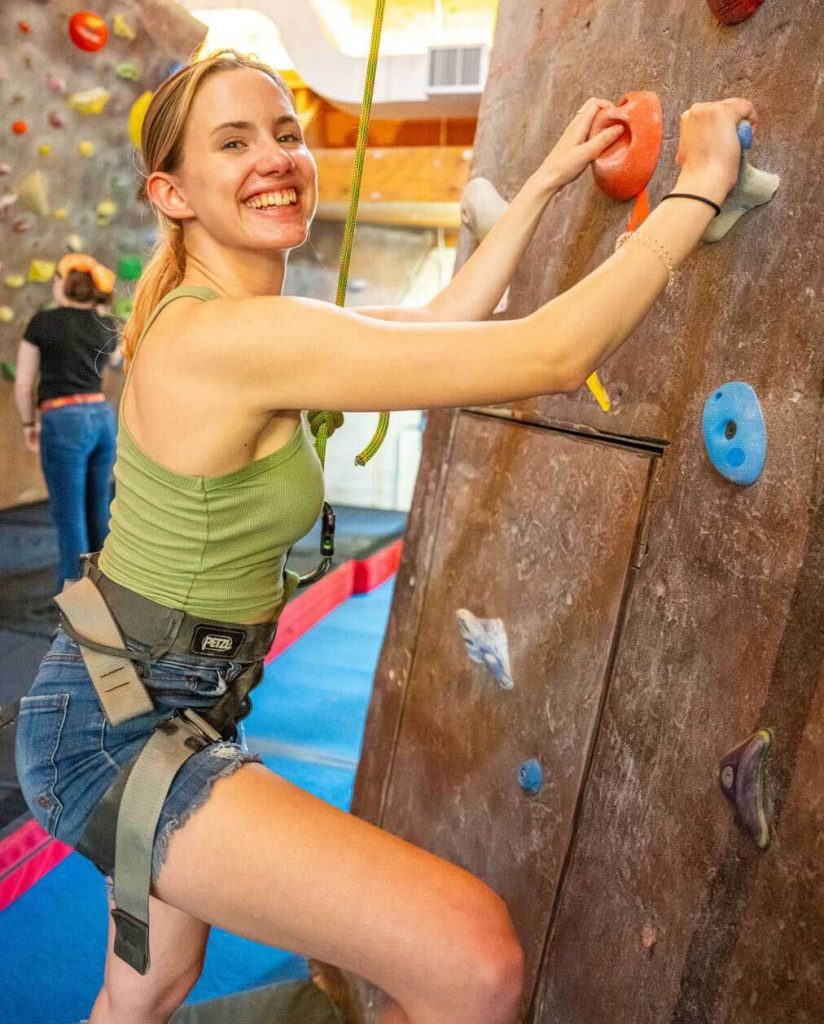
Find your people here
Experience new adventures and make new friends! With tons of student clubs and organizations, access to beautiful forests and waterways right on campus, and an action-packed campus events calendar, you’ll be hard-pressed to find a bored student at UMaine.
Students and faculty from around the country and the world make the UMaine community one of the most diverse in the state.
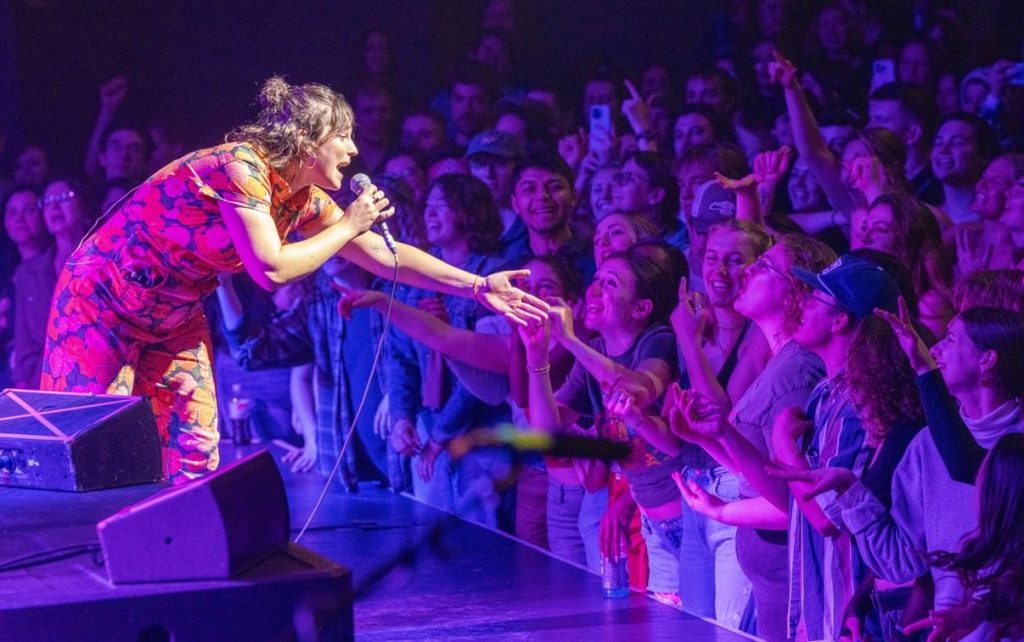
Community & events
Our campus is a hub of activity, fostering connections and collaboration. Join us at one of our upcoming events. From academic symposiums to cultural festivals, there’s always something exciting happening at UMaine.
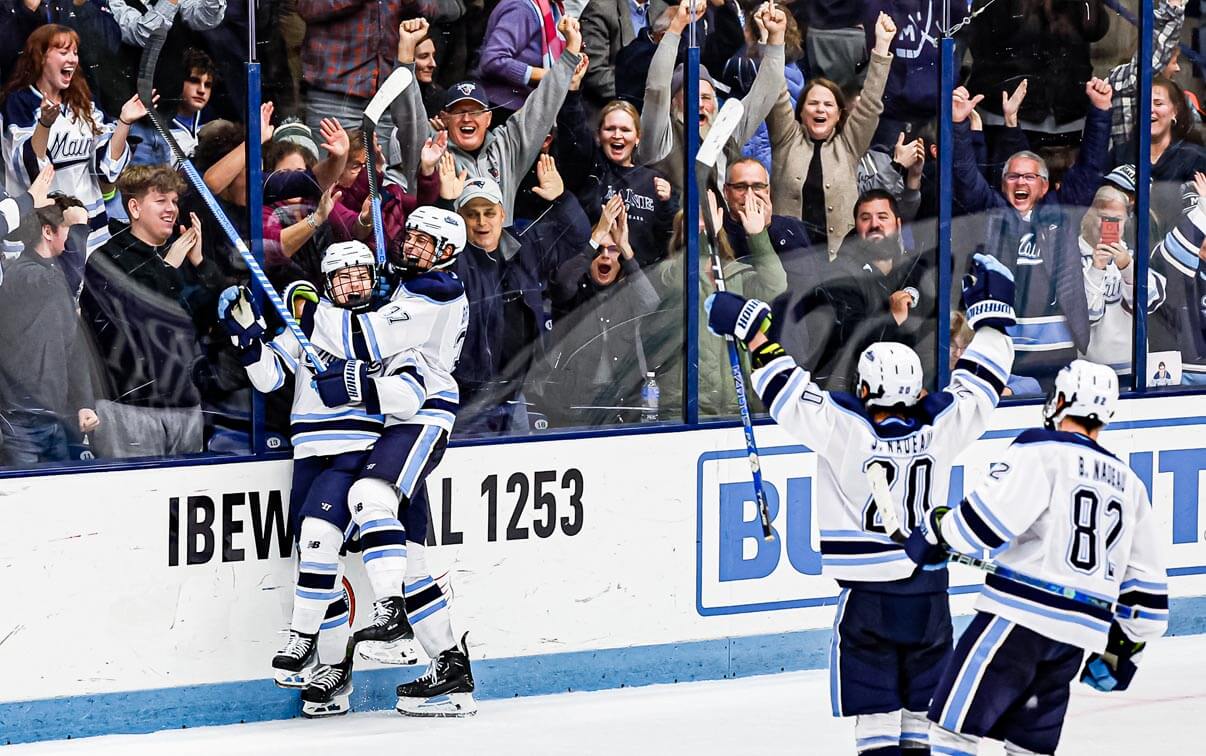
Maine’s NCAA DI program
From the roar of the crowd at Alfond Arena during hockey season to the exciting matchups on Morse Field, experience the thrill of Black Bear athletics.
Get informed, stay connected
Read the latest on the incredible stories and research coming out of UMaine. Looking to find updates on events, podcast episodes, and more? It’s all right here.