The polar ice sheets of Greenland and Antarctica are the least
explored reservoirs of water on the planet and might be
contributing to global sea level rise as the change size and shape.
The ice sheets covering Greenland and Antarctica contain enough water that if completely melted, would raise global sea level by 90 meters. There is currently a great deal of uncertainty as to how these ice sheets are contributing to sea level rise. Some estimates account for half of the observed 1mm/yr rise in sea level from shrinking polar ice sheets. The large size and remote location of the Greenland and Antarctic ice sheets present obvious logistic and technical challenges to measuring their mass balance (rate of change).
We are conducting two types of programs to better understand current ice sheet mass balance patters. One program involves mapping Antarctic elevation changes with time using an airborne laser altimeter. The second program entails the calculation of local rates of ice sheet thickness changes using the precise field measurements of vertical velocity and snow accumulation rate. This experiment is being conducted at numerous sites in Greenland and Antarctica.
Principal Results
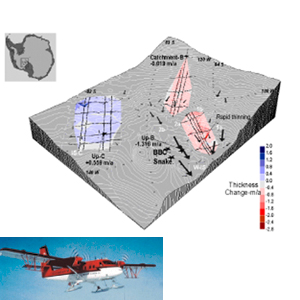
(1) Ice sheet mass balance is spatially variable. Relatively rapid thinning (on the order of 0.1m/yr) is taking place close to the ice sheet margins and in areas of enhanced ice flow. The interior portions of the Greenland and Antarctic ice sheets appear to be close to steady state conditions and are not changing with time.
(2) Large changes are currently taking place in the Siple Coast ice streams of West Antarctica. Portions of Whillans Ice Stream appear to be thinning rapidly, while neighboring Ice Stream C is currently gaining mass.
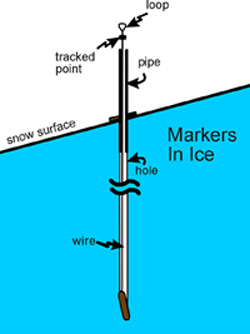
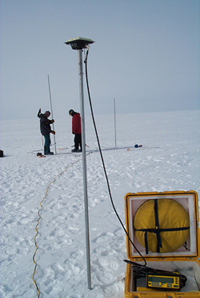
Precise global positioning system (GPS) surveys of markers installed in the ice sheet provide the vertical velocity of ice. Snow accumulation rates are derived from ice core stratigraphy. Both quantities are equal for an ice sheet in steady state. By measuring both quantities at a site, we are able to calculate the rate of ice sheet thickness change.
Airborne laser Altimetry (and shortly, satellite laser altimetry) offers the capability to repeatedly survey large portions of remote ice sheets. The relatively short interval for repeat measurements makes results susceptible to interannual fluctuations in snowfall. However, we have developed methods to account for short-term variability, allowing us to determine the long-term mass balance of ice sheets using this emerging technique.
Selected References
Spikes, V.B., G.S. Hamilton, B. Csatho and I.M. Whillans. In press. Thickness changes on Whillans Ice Stream and Ice C, West Antarctica from laser altimetry. Journal of Glaciology.
Hamilton, G.S. In press. Mass balance and accumulation rates across Siple Dome, West Antarctica. Annals of Glaciology, 35.
Hamilton, G.S. and I.M. Whillans. 2000. Local changes in ice thickness on the Greenland Ice Sheet from GPS measurements. Journal of Geophysical Research, v. 105(B7), 16,295-16,301.
Hamilton, G.S., I.M. Whillans and P.J. Morgan. 1998. First point measurements of ice sheet thickness change in Antarctica. Annals of Glaciology, v.27, 125-129.