
Computers are useful in their abilities to "crunch" data extremely fast. Climatologists are able to use this speed to order and distribute the results of work generated by others. Although most casual observers of weather data only pay much attention to the quite recent past, it is possible to extend our knowledge of past weather to the time of European settlement here in North America.
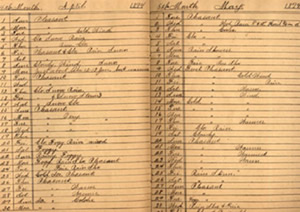
Private and academic individuals began to record the weather systematically. Caleb Holyoke, John Winthrop, and Erza Stiles are examples. Winthrop's students were trained to observe the weather four times a day, recording temperature, precipitation, cloud cover, wind direction, and speed as well as noticing unusual weather. Close to a thousand students followed Winthrop's lead. A standard description was created and the data collected, in some cases into the 1830's. The state of New York and Pennsylvania began systematic collection of data in 1825 using instruments supplied for the schools and academies which did this work.These data are extensive potentially useful. All of the material has been placed on microfilm and are here in the Institute.
Climate Change and New England Agriculture: A Case Study
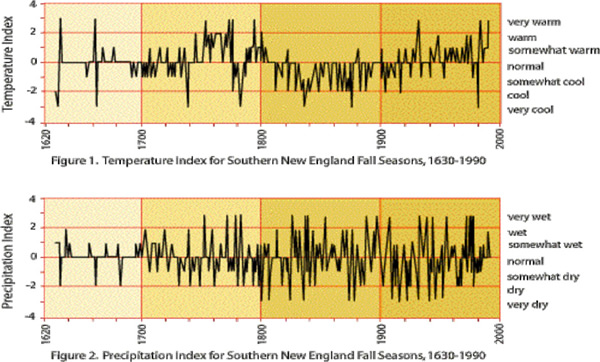
W.R. Baron, of the University of Northern Arizona, and David C. Smith, of the Climate Change Institute, developed a standard dictionary of weather and climate names and applied the results to obtain the longest records in graphs and plots which describe a virtually complete record in New England from 1640. Examples of these results are here on this poster. This methodology provides some startling results. The material can be analyzed by the month creating a very long record.
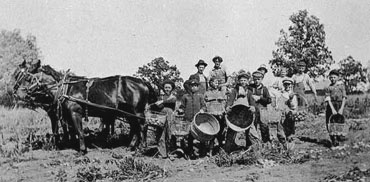
Other plots provide pictures of first and last killing frosts, (that is growing seasons), the dates of corn harvest, corn planting, data on oats, hay and apples, and other crops may be teased out from these data sets.
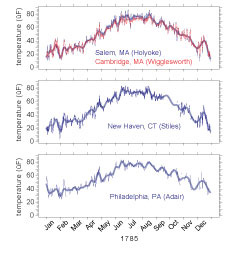
Forensic techniques - Diaries and various historical observational data were used to reconstruct meteorological maps on a synoptic scale for the northeastern portion of North America for the year 1785. The results show that even small amounts of observational data and anecdotal comments can be used to arrive at a general representation of the weather patterns at the regional synoptic scale. Apparently unrelated non-homogenous data sets, traveler's and trapper's journals, ship logs and protests, and other sources, such as newspaper reports, can be successfully combined to reveal the workings of the atmosphere. Using these data a complete synoptic analysis of the year, at semi-diurnal resolution, has been reconstructed, using the techniques of forensic synoptic analysis. Data used to reconstruct synoptic weather include: observational ledgers, diaries, newspapers, ships logs and protests, and travelers journals.
Surface Conditions: Day-to-day synoptic reconstruction is used to resolve individual weather events. Monthly or annual data does not allow such reconstruction. A notable result of surface synoptic analysis on a seasonal basis is the delay in springtime warmth. Although the ranges between summer maxima and winter minima are similar to those of the present-day, the absence of a transition pattern in the spring, and to a certain extent in the fall, indicate a more variable weather pattern in 1785, when compared to the last decade. These results all point to a year in which winter patterns prevail, spring and fall are exceptionally brief, and summer is short.
Upper Air Flow: The same techniques used to develop surface weather patterns at the synoptic scale can be used to reconstruct upper air patterns and flow. The consistency with which the pattern defaults to a coastal baroclinic zone can be explained by a larger temperature difference between land temperatures similar to today and much colder sea surface temperatures. What is notable is the strength of the zonal flow throughout most of the year. This conclusion is supported with both forensic synoptic analysis and anecdotal data. There are many reports of ships being "blown off the coast" and either unable to make their primary destination, or having to turn back to Europe. This can only be explained by a coupling of lower-level jet stream winds and the surface.
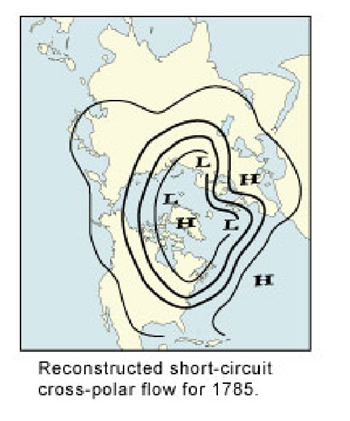
Large Scale Northern Hemisphere Circulation: In 1785 the polar front never fully retreated to its average modern-day summer position. This implies that the polar cell was either larger or displaced towards eastern North America and the Atlantic Ocean in 1785. Proxy studies from two dozen locations elsewhere in the northern hemisphere reveal an upper air pattern which, when combined with the results from this study, outline the polar cell itself. It appears that the polar cell was indeed displaced, as data from eastern Asia and the Pacific do not support a global expansion. This produces a 'short-circuit cross-polar flow' shown schematically above.