
Figure 4, Antarctic pressure patterns
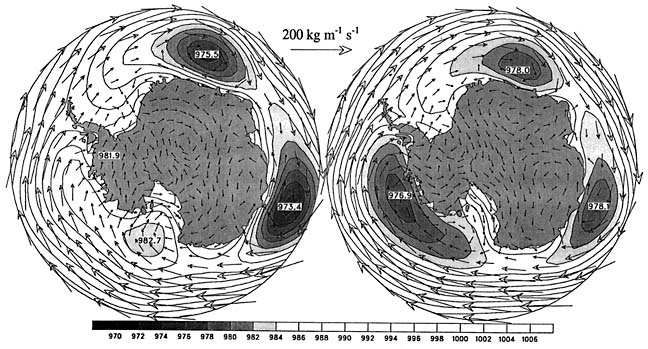
Typical annual pressure patterns for (a) normal (1980) and (b) reduced (1982) West Antarctic precipitation events. Vectors represent vertically integrated moisture flux (maximum is 200 kg/m/s). Mean sea level pressure filed contoured every 2 hPa. From Cullather et al. (1996).
Back to US ITASE Figures