
Figure 5, Antarctic winter climate map
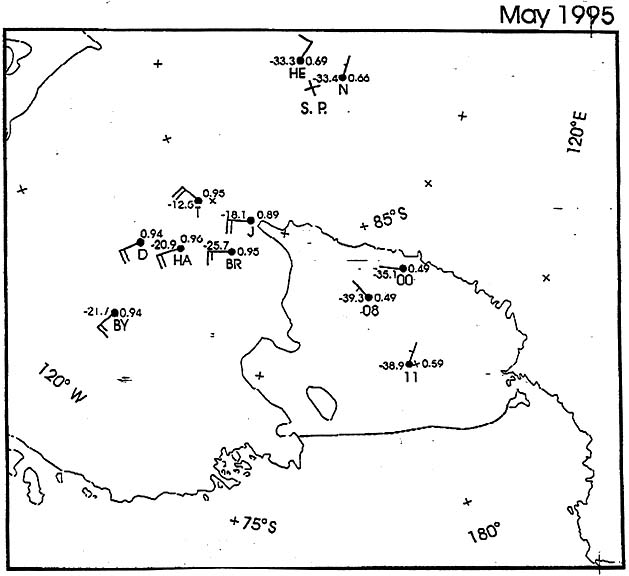
Near-surface winds and potential temperatures measured over West Antarctica and surrounding areas by automatic weather stations (AWS) during May 1995. For each AWS site (denoted by bold letters or numbers) the monthly mean potential temperature in degrees C is listed to the left and the monthly directional constancy is plotted to the right. The vector-average wind vector is plotted according to conventional notation.
Back to US ITASE Figures