
Printer Friendly: pdf version
Hook:
In the 1980's scientists discovered that a hole in the ozone occurs
over Antarctica in the austral summer. The ozone shield screens
out most of the sun's harmful UV rays. Without the shield, humans
are much more susceptible to sunburn, UV radiation, and, thereby,
cancer. In this activity, students will learn about the dangers
of UV radiation and why the study of the ozone hole over Antarctica
is so important.
SubTitle
How UV radiation affects your skin type and why scientists are monitoring the hole in the ozone over Antarctica
Contact
Jan French
Cincinnati Country Day School
6905 Given Rd.
Cincinnati, OH 45243
frenchj at countryday.net
Overview/Objectives:
In this lesson,
students will use a UV detection meter to record the daily UV
penetration by the sun. They will use this data to discover their
own susceptibility to a sunburn for each day, based on their skin
type. Students will then research the cause of sunburns, the ozone
layer, and the hole in the ozone to learn how the ozone layer
forms, how it protects us from UV radiation, and why there is
a hole in the ozone layer over Antarctica in the austral summer.
Grade level
Grades 5-8
environmental science, chemistry, and health. Applicable to high
school students by scaling the lesson up so that a deeper understanding
of the chemistry of ozone production and depletion is studied.
Applicable to K-4 by deleting the chemistry portion of the lesson.
Standards
Content
Standard B: Physical Science
All students should develop an understanding of properties and
changes of properties of matter.
Content Standard D: Earth and Space Science
All students should develop an understanding of: structure of
the earth system and Earth in the solar system
Content Standard F: Science in Personal and Social
Perspectives
All students should develop an understanding of personal health
and natural hazards
Prep
Make enough copies of the Daily UV chart for the whole class
Materials
Sunsor UV detection meter; available at:
http://ourworld.compuserve.com/homepages/sunsor
Sunsor UV exposure guide (accompanies meter; may also be accessed
from the website above)
Sunsor skin type guide (accompanies meter; may also be accessed
from
the website above)
UV detection beads from: Educational Innovations, 1-888-912-7474
(five per student)
Pipe cleaners (one per student)
Daily UV Chart
One pair of sunglasses without UV protection
One pair of sunglasses with UV protection
Time
3 one-hour classes plus 10-mins each day for a month to collect
data
Engagement
1. Give each student one pipe cleaner and 5 UV detection beads.
They are to thread the beads onto the pipe cleaner and then
twist the ends of the pipe cleaner together to form a bracelet.
2. Send the class outside on a sunny day and observe what happens
to the beads (they turn from white to an assortment of colors).
Bring them inside and have them observe the beads again (after
a few minutes, the beads will turn back to white).
3. Elicit from the class why they think this happened. If no
one guesses that it has something to do with the sun, then provide
the answer. Ask them if they think it would happen on a cloudy
day and then try it again to see (if the day is not too overcast,
beads will turn color again because some UV rays can still penetrate
through the clouds).
Explanation
4. Explain that these beads are ultraviolet detection beads
and they are specially made to change color in the presence
of ultraviolet radiation. Ask if anyone knows what UV radiation
is, and if not, explain. Further explain that UV rays are the
sector of rays that cause sunburn and skin cancer and because
of that they are dangerous to us. Explain that the class will
be recording UV radiation for a month and figuring out how that
radiation directly affects them. Let them keep the beads and
notice the color changes over the course of a week.
5. Give each student a Determine Your Skin Type chart and have
them decide what their own skin type is based on the skin type
definitions on the chart (younger students may need help with
this).
6. Give each student a Daily UV Chart to record their results.
7. Show the UV detection meter and demonstrate how to use it
outside. Let one student read the measurement. Have the class
record the measurement on their chart. Decide as a class what
the sky looks like that day ( sunny, partly cloudy, mostly cloudy,
overcast), and record it on the chart.
8. Direct the class to look at the graph that is applicable
to their skin type. Have them decide what their skin reaction
will be after 1, 3, and 5 hours in the sun, and write these
reactions on their chart.
9. Tell the class you have two pairs of sunglasses. Hold the
pair without UV protection between the sun and the meter. Have
a student read the UV measurement. Do the same with the pair
that has UV protection and compare the results. Ask the class
if they can think of a reason that they would get different
readings. Explain that one pair had UV protection and one didn’t.
Elaboration
Go on to procedure #10 while continuing to record the UV data
for a month. After one month, have the class look at their data,
and answer the following questions:
What is the highest UV reading you recorded? The lowest?
Can you make a correlation between the amount of cloud cover
and
the UV measurement? (Students should be able to see a general
trend of higher UV measurements on days with little cloud cover
and lower measurements on days with a lot of cloud cover.)
10. While the class continues to record their UV measurements (let the students take turns going outside for the reading), they will access NASA Educational Resource website on UV radiation (or teacher may provide a hard copy): http://www.nas.nasa.gov/About/Education/Ozone/radiation.html
Answer the following questions:
What are the three factors that affect the amount of
radiation at a particular location?
What are the health effects of UV radiation?
11. Students access the National Science Foundation
Polar Programs UV Monitoring Network website on the UV measurements
taken at the South Pole (or teacher may provide a hard copy):
http://www.biospherical.com/nsf/updates/austral/cuvindex.htm
a. Students study the graph to find a correlation
between the highs in the UV index and the time of year. UV highs
are associated with austral summer months (September-February).
b. Elicit predictions from the class as to why they think the
high UV measurements are in the austral summer months. Ask if
anyone knows what ozone is. Tell the class that ozone is a layer
of O3 molecules in the stratosphere that blocks most of the
UV rays from hitting the earth.
c. Direct students to access the National Science Foundation
Polar Programs UV Monitoring Network “Ozone” website:
http://www.biospherical.com/nsf/student/page1.html
Answer the following questions: What is ozone? How is it formed?
Review their answers and fill in any gaps using Fig. 1a (attached).
12. Direct students back to the previous website
and click on “ozone
hole” under the heading “How is it distributed over
the globe?”
and ask them to find out where the hole in the ozone is and
how
ozone is destroyed. Review their answers and fill in any gaps
using Fig. 1b (attached). Explain why there is a hole in the
ozone over Antarctica (refer to University of Cambridge website
for a concise explanation).
Exchange
13. Draw the class’s attention back to the graph in procedure
#10, and explain that during the austral summer, the ozone may
be depleted by as much as 50%. Ask them to explain why there
is a seasonal difference in the UV readings at the South Pole.
14. Students will write a one page report to
explain the following concepts: What is UV radiation?
What is your skin type and how is effected by the amount of
time spent in the sun?
What is ozone?
Why is ozone important to us?
How is ozone formed?
How is it destroyed?
What is meant by the hole in the ozone?
Where is the hole and when does it develop?
Why does the hole develop at a particular time of year?
Evaluation
Evaluation may be based on:
1. the accuracy and completion of the Daily UV chart
2. the ability to scan for information on the Internet
3. level of understanding of the basic concepts as
demonstrated by the student's report
Background
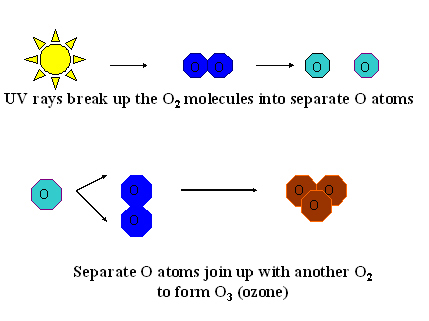
Ozone (O3) is produced in the earth’s stratosphere and
forms a protective shield against ultraviolet (UV) radiation
from the sun. The shield screens out most of the harmful UV
rays, which cause cancer. This ozone is formed by the sun’s
rays hitting and splitting up oxygen molecules (O2) into separate
oxygen atoms. These atoms then join with other O2 molecules
to form the protective ozone (O3). See figure 1a.
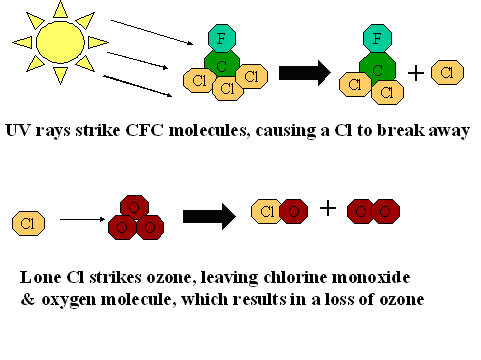
It was discovered in the mid 1980’s, that a hole in the ozone occurs over Antarctica in the austral summer. International concern led scientists to study the hole to learn why it happens and what can be done about it. In simple terms, the breakdown in ozone is caused by emissions from factories of chlorofluorocarbons (CFC’s). When the sun’s rays strike CFC’s, a chlorine atom breaks away and strikes an O3 molecule, which in turn splits into one ClO and one O2 molecule, which results in an overall loss of O3 or ozone (fig.1b).
| Skin Type | Hair/Eyes/Skin | Reaction to Sun |
| 1 | Red/blonde hair
Blue/green eyes Very light skin |
Mostly burns
Never tans |
| 2 | Light-medium hair
Light-medium eyes Light-medium skin |
Usually burns
Seldom tans |
| 3 | Medium hair
Medium-dark eyes Medium to olive skin |
Moderately burns
Usually tans |
| 4 | Dark hair
Dark eyes Dark olive-light brown skin |
Burns mildly
Tans easily |
| 5 | Dark hair
Dark eyes Dark skin |
Seldom burns
Dark brown tan |
| 6 | Dark hair
Dark eyes Very dark skin |
Insensitive to sun
Does not burn |
Modified from: http://ourworld.compuserve.com/homepages/sunsor
| Date | UV Measurement | Cloud Cover | Skin Reaction:
1 hour |
Skin Reaction:
3 hours |
Skin Reaction:
5 hours |
Cloud Cover: sunny, partly cloudy, mostly cloudy, overcast
Resources
Environmental Protection Agency: Ozone Depletion
http://www.epa.gov/docs/ozone/science/hole/index.html
National Atmospheric and Space Administration:
http://see.gsfc.nasa.gov/edu/SEES/strat/class/Chap_11/11_1.htm
National Science Foundation Polar Program UV Monitoring Network
http://www.biospherical.com/nsf/index.asp
University of Cambridge: Center for Atmospheric Science
http://www.atm.ch.cam.ac.uk/tour/part3.html