
 New Zealand
 Prepared by: Nancy Bertler
email: nancy.bertler at vuw.ac.nz
Field Activities
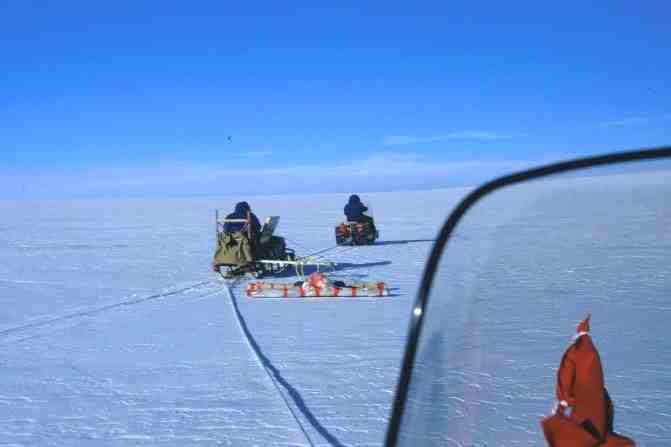
Ground Penetrating Radar (GPR) applies high frequency radar pulses (20M to 1G Hz) to map internal flow structures in glaciers and ice sheets based on reflection properties. For mapping Victoria Lower Glacier and Wilson Piedmont Glacier, a GSSI SIR 10 A was used, a system that allows a maximum time window of 10,000ns. A 35MHz antennae-pair (Radarteam AB-SE-40) (or alternatively a 200 or 400MHz antennae) was mounted on a fibre glass frame and travelled tied to a truck inner-tube just a few cm above the ground. The system was connected to a Nansen Sledge, which carried the control units, generator, solar panels and laptop. Matt Watson from University of Auckland operated the system and post-processed the GPR data. A Trimble 4000SSE differential, kinematic GPS provided absolute positioning of the GPR data. For high precision GPS data, a base station was installed on a nearby rocky outcrop of the Staeffler Ridge instead of using the 120km distant McMurdo Base Station. The sledge was pulled and tailed by skidoos for crevasse safety. Average travel speed was 10-15km/h to allow sufficient GPR and GPS precision. Measurements were taken every 15 seconds.
 The
coffee-can method [Hamilton and Whillans, 2000; Hamilton
et al., 1998] and Hamilton pers. communication 1999, 2002) determines
mass balance by comparing vertical velocity of a marker in firn or ice
with long-term, average snow accumulation rates. A non-stretchable,
stainless steal wire was attached to a metal anchor that was heated
until glowing red and thrown into the drilling hole of the firn core.
The anchor melts the bottom ice and subsequently freezes in. On the
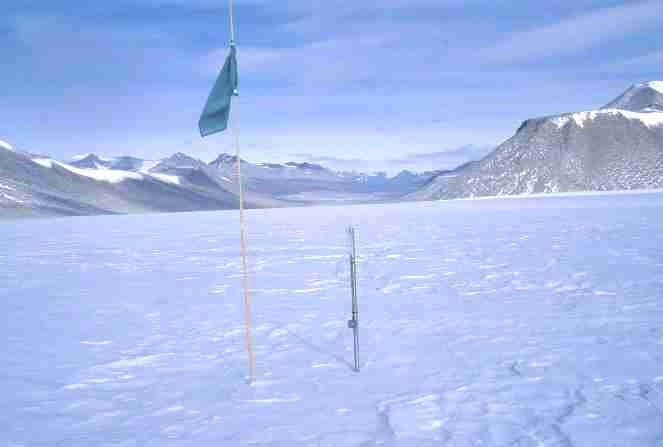
top of the hole, the wire is guided by a stainless steal rod. The rod
is held in place with a piece of plywood that has been buried some 40cm
into the snow to avoid melting around the darker surface. The top end
of the wire has a loop and permanent marker, the tracking point. High
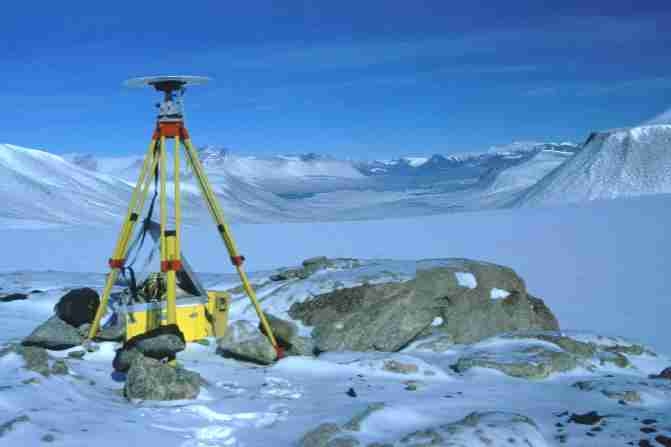
precision GPS measurements were used to determine absolute position
of the tracking point during subsequent years. The absolute movement
of the tracking point is the result of three motions: firn compaction,
gravitational glacial flow and mass balance changes.
The
coffee-can method [Hamilton and Whillans, 2000; Hamilton
et al., 1998] and Hamilton pers. communication 1999, 2002) determines
mass balance by comparing vertical velocity of a marker in firn or ice
with long-term, average snow accumulation rates. A non-stretchable,
stainless steal wire was attached to a metal anchor that was heated
until glowing red and thrown into the drilling hole of the firn core.
The anchor melts the bottom ice and subsequently freezes in. On the
top of the hole, the wire is guided by a stainless steal rod. The rod
is held in place with a piece of plywood that has been buried some 40cm
into the snow to avoid melting around the darker surface. The top end
of the wire has a loop and permanent marker, the tracking point. High
precision GPS measurements were used to determine absolute position
of the tracking point during subsequent years. The absolute movement
of the tracking point is the result of three motions: firn compaction,
gravitational glacial flow and mass balance changes.
To determine long-term, average accumulation rates, the firn core was dated by Gordon Hamilton, University of Maine, using beta activity fallout during 1954/55 and 1964/65. The rate of thickness changes H, can be calculated with the equation:
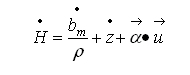
H = rate of thickness change
bm = accumulation rate (mass per unit area and time)
p = density at marker depth to account for densification processes
z = vertical component of ice velocity (upward is positive)
a = surface slope
u = horizontal velocity