
2007 – 2008 US ITASE Field Report
Page 5
Science (continued)

Figure 6 Surface snow sampling coverage for Phase 2 US ITASE (Taylor Dome to South Pole).
Surface Glaciology: Geodetic–quality kinematic GPS data were recorded continuously along the traverse route for the purpose of characterizing ice sheet surface elevations and for geolocating radar data. Three mass balance measurement sites (“coffee cans”) were installed at ice core sites (each site consists of 4–5 markers at depths from 4–25 m). Novel geophysical techniques were used to investigate properties of the surface firn. MADGE (Maine Automated Density Gauging Experiment) uses a high–energy nuclear source to make fine resolution (~3 mm) measurements of density along cores collected with the 2” drill. A second instrument, deployed down the boreholes, makes in situ measurements of borehole wall strength (an indicator of possible locations of missing core, reflectivity (an indicator of grain size), and temperature.
US ITASE 1999-2008 Summary
Since 1999 US ITASE has traversed >8000 km throughout West and East Antarctica (Fig. 7) and collected a total of 3945m of ice core. Together with six shallow cores collected as part of LGT, US ITASE has conducted scientific investigations (ice coring, surface glaciology, radar) at 45 sites and radar (crevasse, shallow, and deep) along almost all of the US ITASE routes. US ITASE has therefore sampled the ice climate record surrounding the Ross Ice Shelf and hundreds of km inland. US ITASE has now completed six field seasons of multi–disciplinary research setting a new benchmark for Antarctic climate multi–disciplinary research
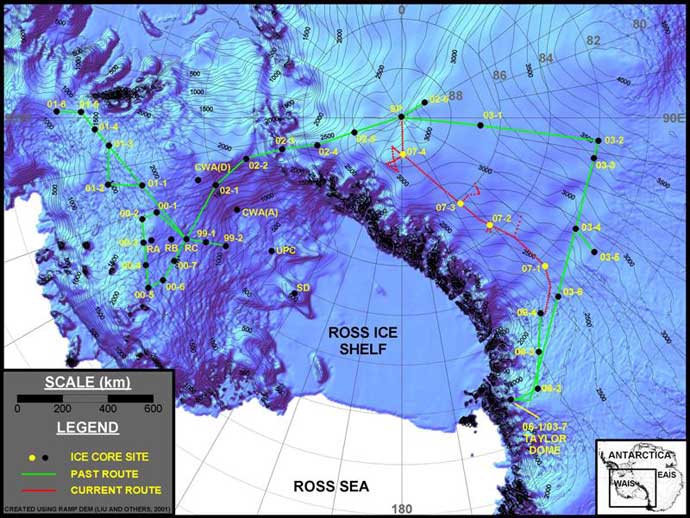 Figure 7 US ITASE routes and study sites.