
Page 4 of 9
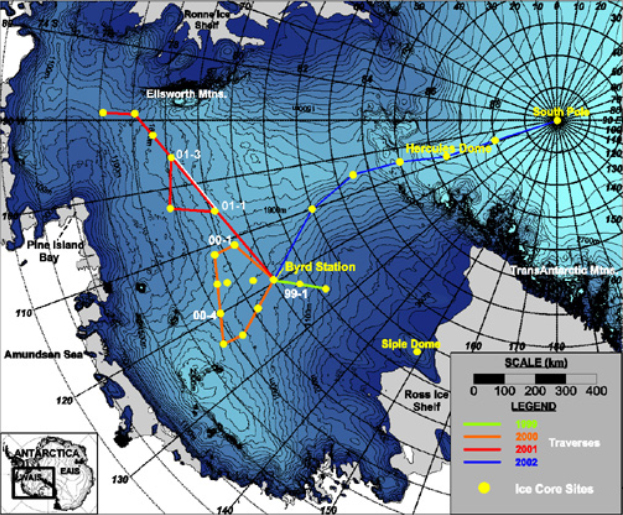
Figure 3 – US ITASE traverse routes, WAIS topography and core sites superimposed on the RAMP DEM (Liu et al., 2000). Data from sites 99-1, 00-1, 00-4, 01-1, and 01-3 are presented in Figures 4 and 5.
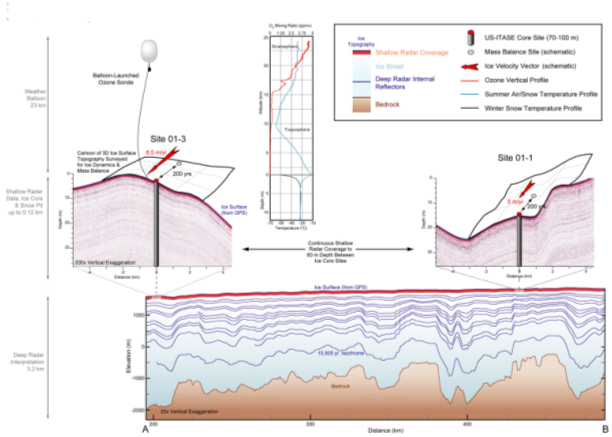
Figure 4: Multi-dimensional approach to the multi-discipline US-ITASE objectives. Studies at a variety of spatial scales extend from the subglacial bedrock surface to over 20 km into the atmosphere. Ice core sites along each traverse route yield 200+ year annually dated climate records. Ice core site selection is determined by field interpretation of shallow radar data. Numerous measurements are made at each core site to provide context for the ice core climate records.These measurements include: high resolution surface topography maps; snow pit measurements of density, chemistry, and temperature; and meteorological data. Ice mass balance and horizontal velocity studies located 200 years upstream provide past ice flow history for the ice cores. Shallow and deep-penetrating radio echo sounding data tie the ice cores together and provide large-scale context for US-ITASE cores and future deep ice core climate records. Internal stratigraphy in both radio echo sounding records represent isochronal events and a record of depositional and ice flow history along the traverse. The radar data and interpretation, ozone sonde data, and ice topography along the radar profiles shown here are actual examples from the 2001 US-ITASE season. Ice topography, mass balance sites, and ice velocity vectors are shown in schematic to represent results obtained once repeat analyses are completed. See Figure 3 (01-1 and 01-3) for locations of the datasets presented in this figure.
Previous page, Next page, or Download entire paper