
SNOW CHEMISTRY ACROSS ANTARCTICA - page 6
Spatial Ion Concentration Variability - continued
Figure 6 shows the spatial variability of NO3, ranging from ~ 4 ppb to ~ 800 ppb. Highest values can be observed in Enderby, Dronning Maud, and Victoria Land, ranging from ~ 30 ppb to 800 ppb. Intermediate values are reported from Marie Byrd Land, Ronne Ice Shelf, South Pole region and Northern Victoria Land (~35 ppb to ~ 100 ppb), while the lowest values are observed on the Antarctic Peninsula and in Kaiser Wilhelm II Land ( ~ 0 ppb to ~ 20ppb). While NO3 has been shown to be effected by postdepositional loss in low accumulation sites (Mayewski and Legrand, 1990; De Angelis and Legrand, 1995; Legrand and Mayewski, 1997; Mulvaney and others, 1998), the lowest values for NO3 have been observed at sites with relatively high annual accumulation – the Antarctic Peninsula and Kaiser Wilhelm II Land. Samples from those sites are collected from the snow surface during August/September 1989 and February 1990, respectively, and contrast to snow surface samples from Enderby Land collected during October 1997, which show some of the highest values in entire data set. This suggests that postdepostional loss of NO3 is strongly dependent on site-specific characteristics
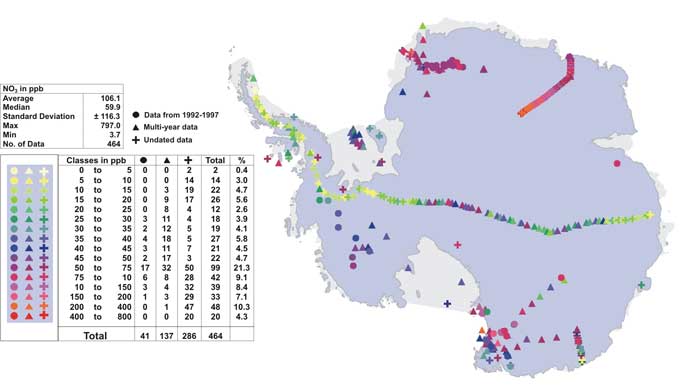
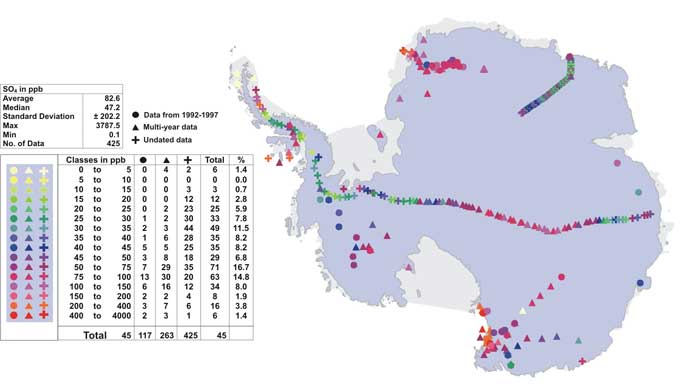 Figure 7: Spatial variability of SO4 concentration measured in ppb.
Spatial variability of SO4 is shown in Fig. 7. The data range from 0.1 ppb to 3,800 ppb. It is important to note that SO4 is particularly prone to sporadic input through volcanic events. As the data set represents different time periods, some of which coincide with volcanic eruptions, it is necessary to interpret SO4 variability carefully. However, many data points in Marie Byrd, Victoria and Dronning Maud Land are contemporary data from 1992-1997 (Fig. 7, solid circles). The SO4 concentrations of those data are higher at Victoria and Dronning Maud Land ( ~ 30 ppb to 3,800 ppb) than at Marie Byrd Land ( ~ 30 ppb to 90 ppb). Furthermore, the transect leading from the Antarctic Peninsula to Kaiser Wilhelm II Land shows large variability. The Antarctic Peninsula is characterised by low values ( ~10 ppb to 30 ppb), with higher values only at coastal sites ( ~ 75 to 1000 ppb). Also the data in Kaiser Wilhelm II Land are relatively low with 15 ppb to 70 ppb. The centre part of the transect, however, shows in comparison high values (~70 ppb to 100 ppb). In addition, the Enderby Land transect also shows an increase in SO4 concentration with elevation\ (from ~10 ppb to 30 ppb). This could be influenced by local accumulation rates and variable SO4 sources.
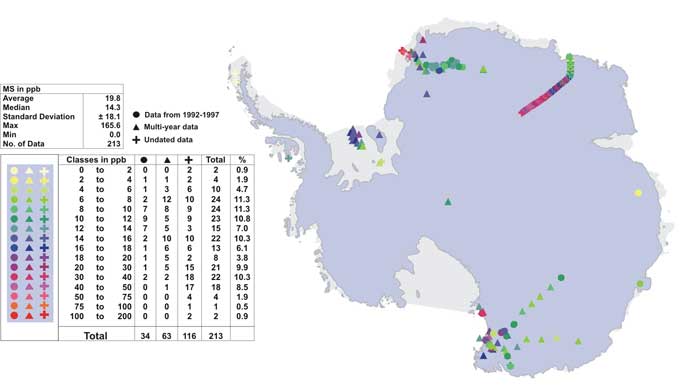 Figure 8: Spatial variability of MS concentration measured in ppb.
In Fig. 8 spatial variability of MS data are shown, ranging from 3 ppb to 166 ppb. In contrast to NO3 and SO4, MS is thought to be predominantly derived through wet deposition due to its high Henry constant (Udisti and others, 1998; Becagli and others, Annals, 41). Overall the data show highest concentration at coastal sites with deceasing trends inland, with the exception of two areas: the coastal sites at King George and Livingston islands and the transect at Enderby Land. While MS concentrations in the former are unusually low in comparison to other coastal sites ( ~ 0 ppb to 2 ppb), the latter shows a trend from low MS values (0 ppb to 14 ppb) at low elevation to high MS concentrations (14 ppb to 50 ppb) further inland. A similar, but less pronounced increase in concentration along the Enderby Land transect is also observed in the SO4 and NO3 data.