
SNOW CHEMISTRY ACROSS ANTARCTICA - page 5
Spatial Ion Concentration Variability
To further investigate the relationships observed in Fig. 2, the geographical variability is discussed in Fig. 3 to 11. The data for each species have been clustered into colour-coded classes. Due to the large amplitude of variability in ion concentration the classes are not linearly distributed but, rather, according to data distribution. This is necessary as coastal regions for example show Na concentrations that are four orders of magnitude higher than those in the Antarctic interior (Fig.3). As a result a linear scale would under represent the variability with only one class for the entire Antarctic interior or for coastal sites. To compare sites within the Antarctic interior, or various coastlines, it is necessary to tune the classes so that variability at low and high concentrations can be observed. The legend shows the percentage and number of data points contained in each class. Furthermore, data have been distinguished into three groups: well dated data representing 1992-1997 time period (solid circles), all other multi-year samples (solid triangles), and undated or non-annual samples (crosses). The colour coding for concentration classes is the same for all three groups.

Figure 3: Spatial variability of Na concentration measured in ppb. Solid circles represent data from 1992-1997. Solid triangles represent all other multi-year data. Crosses represent non-annual or undated samples.
Spatial variability of Na concentration is shown in Fig. 3, ranging from ~2 ppb to 14,680 ppb. As expected the East Antarctic interior shows significantly lower values (2 ppb to ~30 ppb) than the coastal sites (~75 ppb to 14,680 ppb). However, high values have also been reported from Marie Byrd Land at high elevation, and low concentrations in the vicinity of the East Antarctic coastlines (Kaiser Wilhelm Land and Terra Adelie). Furthermore, the change from very low to very high concentrations seems to occur within a narrow band in the vicinity of the coast. While high Na deposition is readily explained in coastal areas due to high sea-salt input, the narrow zone of marine air mass intrusions (meso-scale cyclonic activity) coincides with the rapid decrease of Na concentrations in the Antarctic interior. Here the katabatic wind streams, transporting Na-depleted air masses from the interior towards the coast, compete with the Na-rich coastal air masses. In contrast, the Antarctic Peninsula shows overall high values and no trends, caused by strong sea-salt input all around and a secondary non-sea-salt contribution from ice-free mountain peaks However it is important to note that most of the data points located on the Antarctic Peninsula are surface samples representing winter snow. As Na peaks in most regions of Antarctica during winter, the higher Na concentrations reported from the Antarctic Peninsula are partially explained by this bias.
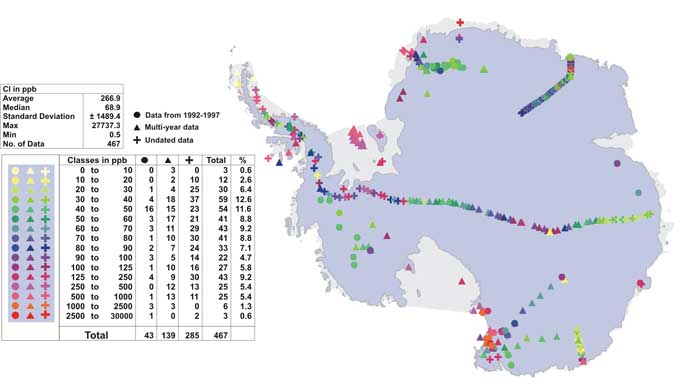 Figure 4: Spatial variability of Cl concentration measured in ppb.
Cl variability exhibits a similar pattern to Na (Fig. 4), ranging from ~~1 ppb to 27,740 ppb. The highest values are observed at coastal sites (~150 ppb to ~27,740 ppb) and lower values in the interior (1 ppb to ~150 ppb). The Antarctic Peninsula again shows overall high values and no significant trend with elevation. Furthermore, Cl shows high concentrations in the centre of the East Antarctic interior, which is also observed in the Na data, but to a lesser degree. In Fig. 5 the spatial variability of the Cl/Na ratio is shown, ranging from 0.2 to 19.3. While most sites show a near seawater ratio of 1.8 (Warneck, 1991), in the Antarctic interior the ratio increases to an average value of 4.3, with data ranging from 2 to 9. Whereas coastal sites are likely to show seawater Cl/Na ratios due to the direct input, elevated Cl/Na ratio in the low accumulation zones of the Antarctic interior are suggestive of secondary Cl precipitation through HCl (De Angelis and Legrand, 1995), which might be partially off-set by HCl re-emission from the upper layers of the snow pack (Udisti and others, in press; Benassai and others, this volume). Overall, Antarctic interior Cl and Na concentrations are depleted in comparison to coastal values (Fig. 3 & 4). However, in the East Antarctic interior Cl seems relatively less depleted than Na, causing an increase in the Cl/Na ratio.
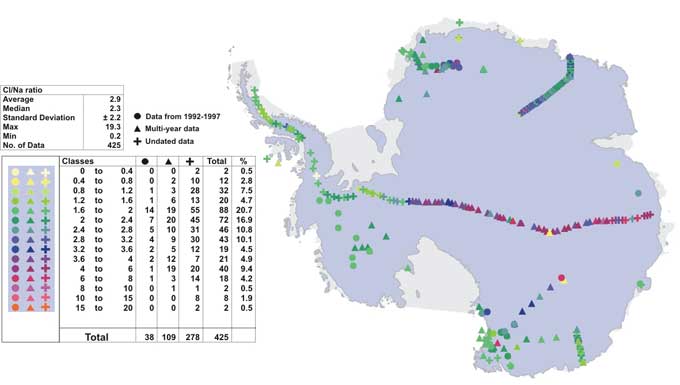 Figure 5: Spatial variability of Cl/Na ratio.